You can keep your home network running smoothly by picking a monitor that matches your skill level, installing it on a stable device, and setting up sensors for each subnet or port you want to watch. Use simple tools like PRTG’s free tier or Spiceworks if you’re a beginner, then upgrade to Domotz, Auvik, or Ntopng for richer dashboards. Secure the system with strong passwords, enable updates, and configure alerts for bandwidth spikes or unauthorized traffic. Visualize real‑time flow with Ntopng’s graphs and Sankey diagrams, then dive deeper with Wireshark or Sniffnet for packet‑level details. Finally, set up reporting in Nagios or Glasswire to stay ahead of issues. Continue and and you’ll discover more advanced tweaks.
Quick Guide
- Choose a monitoring tool matching your skill level: beginners can start with PRTG free tier, Spiceworks, or Ntopng for simple visual traffic.
- Set up sensors or port mirroring on the correct subnet, secure the device with strong passwords, and keep firmware updated to ensure reliable data collection.
- Use real‑time dashboards (e.g., Ntopng’s graphs, Sankey diagrams, and protocol pie charts) to spot bandwidth hogs and latency spikes instantly.
- Employ deep‑packet inspection tools like Wireshark or Sniffnet for granular analysis of suspicious packets, VPN DNS queries, and protocol anomalies.
- Configure alerts and periodic reports via Nagios, Glasswire, or built‑in tool thresholds to receive notifications before bottlenecks become outages.
Why a Home Network Monitor Matters

Why does a home network monitor matter? It lets you spot bottlenecks instantly, keeping bandwidth flowing and latency low. You’ll catch hardware glitches, interference, or unauthorized access before they cripple performance. Early alerts let you tweak settings, avoid outages, and stay compliant with standards. This proactive understanding saves time, money, and preserves the freedom to use your network without interruptions. It also provides real‑time visibility into traffic patterns, enabling quick detection of performance bottlenecks.
Pick the Right Home‑Network Tool for Your Skill Level
After understanding why monitoring matters, the next step is matching a tool to your proficiency. If you’re a beginner, start with PRTG’s free 100‑sensor tier, Spiceworks, or Ntopng for simple visual traffic. Regular maintenance, including keeping firmware up to date and performing periodic restarts, helps ensure stable performance and trustworthy data collection firmware updates. Intermediate users gravitate toward Domotz, Auvik, or OpManager for automated discovery and richer dashboards. Advanced users should consider SolarWinds, LogicMonitor, or Zabbix for deep SNMP, AI correlation, and extensive customization. Choose based on setup ease, sensor limits, visualization strength, and maintenance willingness.
Install and Configure Your Home Network Monitor
First, pick the monitoring tool that matches your hardware and skill level, then set up the sensors and alerts to capture the traffic you care about. Ensure you have secure power and connections for reliable operation, including verifying the C-wire for continuous power. Power supply verification helps prevent phantom outages and ensures stable monitoring. Next, configure the tool’s interface to point at the correct subnet and designate the destination port for mirrored packets. Finally, lock down access with strong passwords and keep the software updated to protect your monitoring station. Persistent blinking white light on the Cox PW8 Gateway can indicate that the device is still undergoing provisioning or experiencing registration issues, which may affect the reliability of your network monitoring setup if your gateway is not properly connected. Cox PW8 Gateway
Select Appropriate Monitoring Tool
Which tool you choose depends on your budget, network size, and need for control. If you crave flexibility and zero cost, try LibreNMS or Icinga for open‑source freedom and API extensibility. SaaS lovers can grab LogicMonitor for instant multi‑cloud coverage, while SolarWinds or PRTG serve larger setups with deep customization. Small homes benefit from IPHost’s low price or PRTG’s free sensor tier. Choose the one that aligns with your freedom‑first mindset.
Configure Sensors and Alerts
Choosing the right monitoring tool is only half the battle; you now need to get the sensors installed and the alerts wired up so the system can actually report what’s happening on your network.
Pick a Raspberry Pi, spare phone, or router‑based sensor, place it near heavy traffic, enable port mirroring, and connect via Ethernet.
In NetAlertX, select the proper interface, add ping and DNSIP sensors, configure Gotify or Apprise, and set binary sensors to trigger automations when a device goes offline.
Secure Access and Updates
How do you keep your home network monitor both reachable and up‑to‑date? Secure access by enabling HTTPS on your router and switch admin pages, then change default passwords. Set automatic updates for PRTG, Nmap, iptraf‑ng, NetAlertX, and Ntopng via their settings or package manager. Restrict remote login to VPN‑only connections. Regularly review firmware releases for ARRIS, NETGEAR, and ASUS devices, and apply them promptly.
Visualize Traffic and Spot Bottlenecks With Ntopng

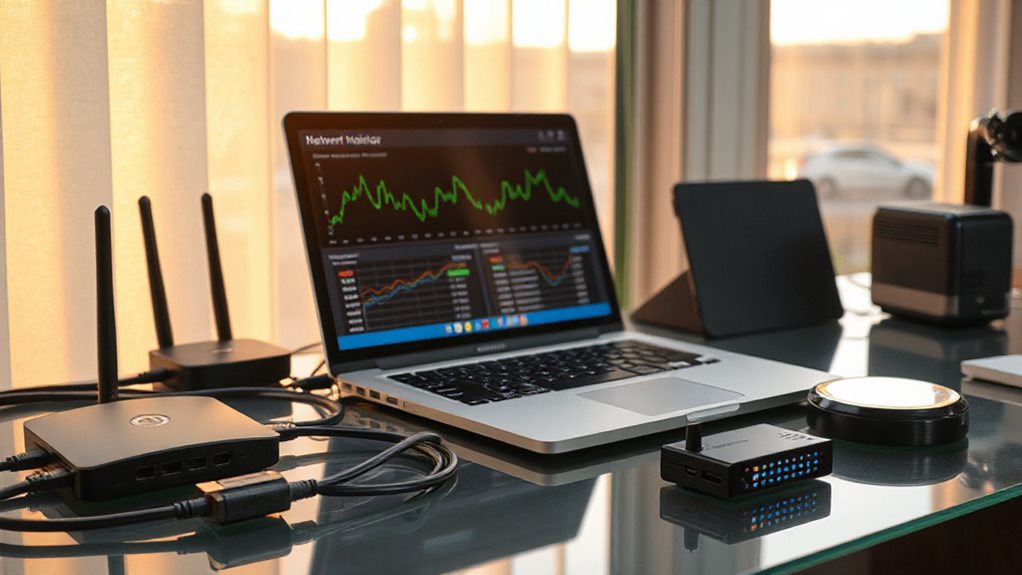
You’ll see live graphs on Ntopng’s web dashboard that show traffic flow and bandwidth usage in real time. By watching the spikes and comparing host activity, you can pinpoint which devices or applications are choking the network.
The interface lets you drill down into specific protocols, making it easy to identify and address bottlenecks.
Real-Time Interface Graphs
Ntopng’s web‑based dashboard turns raw traffic into live visualizations that update every few seconds, letting you see exactly what’s happening on each interface.
You’ll watch Sankey diagrams map host pairs, pie charts split traffic by protocol, and dynamic pages refresh without clicks.
Multi‑interface views let you monitor several segments simultaneously, while DPI classifies protocols and highlights top talkers instantly.
Identify Bandwidth Bottlenecks
Where does your network slow down, and which devices are causing it? Ntopng’s web UI shows real‑time traffic, letting you spot bottlenecks instantly. Use the flow matrix and top‑talker list to locate heavy users. Enable Layer‑7 detection to see protocol‑specific hogs. Set threshold alerts for bytes per host, and integrate with Nagios for notifications. Customize dashboards to focus on problematic subnets.
Inspect Packets Deeply Using Wireshark or Sniffnet
When you need to see exactly what’s moving through your network, deep packet inspection with Wireshark or Sniffnet gives you the detail you need.
Wireshark captures in real time, supports 1,100+ protocols, and offers color‑coded GUI filters for granular analysis.
Sniffnet runs lightweight, processing over 100k packets per second, previewing headers instantly and exporting PCAPs for deeper Wireshark immersions.
VPN-related insight: Using a VPN helps encrypt data and secure DNS requests, so you can also verify that DNS queries are being processed by a trusted provider rather than your ISP. DNS protection
Set up Alerts and Reporting With Nagios or Glasswire

If you want to stay ahead of network issues, set up alerts and reporting with either Nagios or Glasswire. In Nagios, configure email contacts, define host and service templates, and set five‑minute check intervals. Install NRPE on remote devices, edit nrpe.cfg, and open port 5666. Test alerts via the web UI. Real-time monitoring enables proactive responses and helps verify that your alert rules fire correctly. Glasswire provides real-time notifications and customizable reports without complex server setup. VPN protection is recommended when using monitoring tools that access or transmit data over networks.
Maintain Your Home Network Monitor for Ongoing Security
Keeping your home network monitor effective over time means treating it like any other security system: you must regularly update its data, refine its thresholds, and verify that every sensor still works. Review baseline logs weekly, adjust dynamic thresholds, and patch firmware. Rotate sensor placement on switches, routers, and wireless points. Test alerts, prune stale rules, and document topology changes to keep monitoring agile and your data retention and security posture aligned.
Wrapping Up
By monitoring your home network, you’ll spot issues early, protect devices, and keep performance optimal. Choose a tool that matches your skill level, install it correctly, and configure visualizations, packet inspection, and alerts. Regularly review reports and update settings to adapt to new threats or bandwidth demands. Consistent monitoring ensures a secure, reliable network without unnecessary complexity.